
Denis L. Bourke and Robert H. Eather
Squash Magazine (Nov. 2021) published a feature article (Ref. #1): “The Ratings Game – An Analysis of US Squash Ratings.” In the article the authors showed that the Club Locker ratings – now known as the Universal Squash Rating (USR) – based on match data collected from previous competitive play, unsurprisingly predicted the results of future play with reasonable accuracy. The article interested us and led us to consider whether a mathematical approach might provide even more insights into factors that contribute to the outcome of a squash match.
We considered a logical input parameter for such an analysis to be the probability of a player winning any single point (PwP) against one’s opponent, with each point considered an independent event. It is important to understand that PwP is not a measure of a player’s absolute ability, but rather is a measure of ability versus that of the current opponent.
Our analysis is purely theoretical, based on probability theory. Throughout, we express the probability of winning a Point, Game, or Match as a percentage. (For example, a probability of 0.5 is expressed as a 50% probability.) The results of this analysis show a close correlation between our approach and the USR system.
Although our analysis is purely theoretical, we believe it provides some interesting and valuable insights into the game and how to play it. As expected, a player with the 50% PwP against his opponent will win the Game and the Match 50% of the time. Interestingly, our analysis shows that a 50% PwP will result in a tie at 10-10 in one out of six games, and that the probability of winning the Match 3-0 is just 12.5%. If your PwP is 55%, a seemingly small advantage, you will win a Game 68% of the time and the Match 82% of the time (Figure 1). Further, if your PwP is 40%, then you are doomed to lose any Game 83% of the time and the Match 96% of the time.
Table 1 (below) and Figures 2a and 2b (shown in the Spreadsheet download from the URL provided later in this article) show the results for two evenly matched players (PwP’s = 50%) when one player increases his PwP by just 1% to a PwP of 51% (as entered in the yellow box of the Spreadsheet). The result is quite dramatic: 1% increase in the PwP improves the probability of winning a Game by 3.8% and the probability of winning the Match by 7.1%, which is a pretty nice return on investment!
Table 1: Summary of Probabilities for PwP = 50 and 51:
| % Probability you win a given point (PwP): | 50.0 | 51.0 |
| Win Game at 11: | 41.19% | 44.75% |
| Game goes to 10-10: | 17.62% | 17.55% |
| Win Game after 10-10: | 50.00% | 51.66% |
| Win Game at 11 or after 10-10: | 50.00% | 53.81% |
| Win Match 3-0: | 12.50% | 15.58% |
| Win Match 3-1: | 18.75% | 21.59% |
| Win Match 3-2: | 18.75% | 19.95% |
| Win Match 3-0 or 3-1: | 31.25% | 37.17% |
| Win Match 3-0, 3-1 or 3-2: | 50.00% | 57.12% |
| PROBABILITY YOU WIN ANY INDIVIDUAL GAME BY ANY SCORE: | 50.00% | 53.81% |
| PROBABILITY YOU WIN OVERALL MATCH BY ANY SCORE: | 50.00% | 57.12% |
So, this is the most surprising result from our analysis: for closely matched players, a seemingly small increase in the probability of winning any point results in an unexpectedly large increase in the probability of winning a Game and the Match.
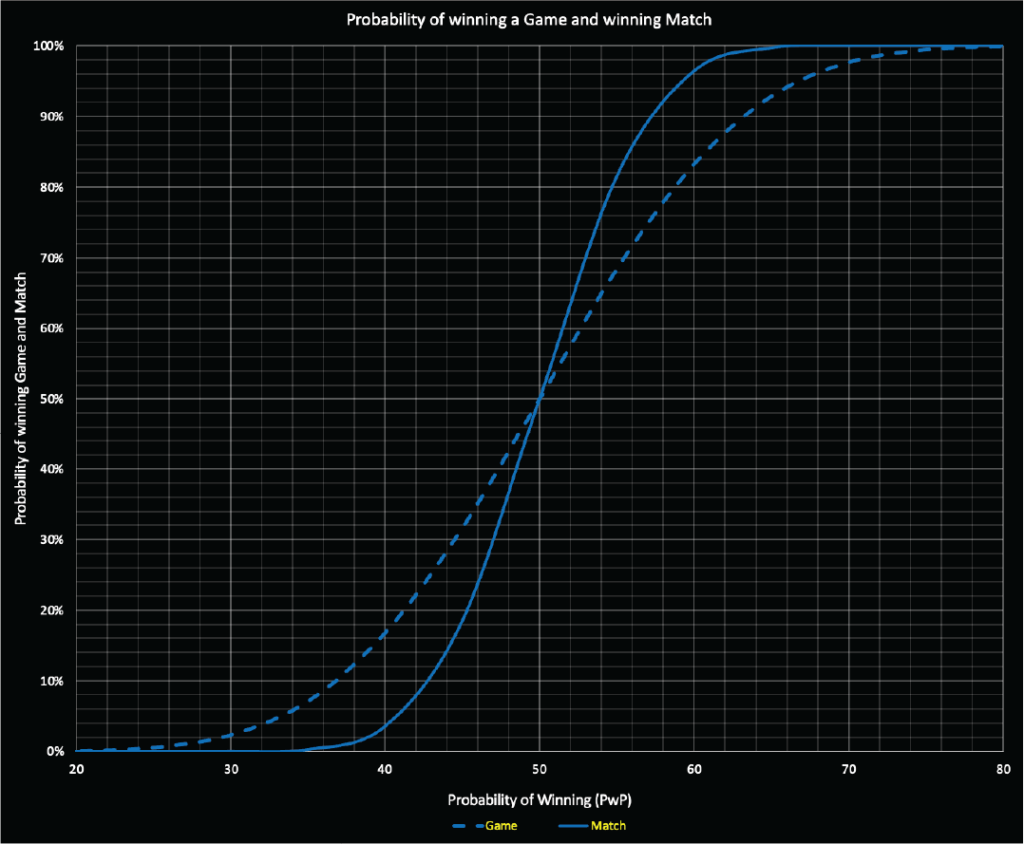
Figure 1: Probability of winning a Game or the Match as a function of Percentage Probabilty of winning Point (PwP)
We wondered whether this may just be the nature of competitive sports, or whether an adjustment to the squash scoring system could give the weaker player a slightly better chance of winning. Using our probability analysis, we examined numerous scenarios. We limited our examination to matches between closely matched players that would total 80 to 100 points, thus ensuring a decent workout in a decent amount of time. We looked at shorter games (5 to 7) points and more games to win a match (4 out of 7, and 5 out of 9). We looked at longer games (15 and 21 points) and fewer games to win the match (2 out of 3). We even considered a match consisting of a single game to 50 points. In all these cases we included the possibility of a tied game. which then required a two-point advantage to win. Under all scenarios, the player with the higher PwP had nearly the same higher probability of winning as with the standard scoring protocol to 11 points. The 7:1 “return on investment” discussed above changed only within the range of 6.9 to 7.7
Because of our interest in the Squash Magazine article (Ref. #1), we wanted to compare our theoretical results with their empirical results, which were based on analysis of about 80,000 matches and 10,000 players. Their first graph, Rating Difference versus Probability of Player #1 Winning, takes a sigmoid shape, but offers no insights as to why the curve is that shape. It shows a relatively straight line slanting upward for small rating differences. The curve flattens out on either end where rating differences are large. Our Figure 1, Percentage Probability of Winning a Given Point (PwP) versus Probability of Winning a Game or the Match, takes a very similar sigmoid shape. We compared the two graphs by scaling our theoretical curves to match the central linear portions of the empirical curves (corresponding to closely matched players) The best-fit scaling is a 1% unit of PwP equal to a 0.047 USR difference.
We define DiR as the difference in Universal Squash Rating between you and your opponent. The DiR corresponding to your PwP is shown in Table 1 of the Spreadsheet. In Table 2 (below), we compare the results of our theoretical results with their empirical best-fit formula to the gathered match data.
Table 2. Comparison of Empirical versus Theoretical Probability of a Win at the Same Rating Difference
| PwP (%) | Rating | Empirical Prob. | Theoretical Prob. |
| Difference | of Winning | of Winning | |
| 50 | 0.000 | 50.0 | 50.0 |
| 52 | 0.094 | 64.3 | 64.0 |
| 55 | 0.240 | 81.9 | 81.5 |
| 60 | 0.527 | 96.5 | 96.4 |
| 65 | 0.910 | 99.7 | 99.7 |
Clearly, there is a very close correlation between our theoretical results and the empirical results. This gives us confidence that our theoretical approach is an accurate reflection of actual play, and that further analysis of the results of our calculations can provide useful insights into the game of squash and how to play and win.
Against a comparable player, regardless of the two players’ rankings, small improvements in a player’s PwP will reap large benefits. This benefit maximizes when playing an opponent of similar ability but decreases quite rapidly with the disparity in player abilities (Table 3 below, and Figures 2a and 2b).
Table 3. Fall-off of Increased Probability of Winning with Increasing PwP
| Original | % Prob. of | Increase in Ability as Measured by PwP | |||
| PwP | Winning | 1 | 2 | 5 | 10 |
| Match | % Increase in Probability of Winning | ||||
| 50 | 50.0 | 7.1 | 14.0 | 31.5 | 46.4 |
| 51 | 57.1 | 6.9 | 13.4 | 28.9 | 40.5 |
| 52 | 64.0 | 6.5 | 12.4 | 25.6 | 34.5 |
| 55 | 81.5 | 4.5 | 8.1 | 14.9 | 18.2 |
| 60 | 96.4 | 1.2 | 2.1 | 3.3 | 3.6 |
| 65 | 99.68 | 0.14 | 0.22 | 0.31 | 0.33 |
Rather than try to illustrate further results here, it is far more instructive to download the interactive Excel workbook from the following URL. You do NOT have to be familiar with Excel, but you will need Excel installed on your computer. (If your computer asks to allow Macros from the download, you should accept.)
https://www.filemail.com/d/ntqvcckhonznhpw
The “Squash” spreadsheet of the Excel Worksheet download (shown here as Figure 3) will allow you to change the input PwP in the yellow box above Table 1, which will then update. In addition, you can enter an improvement in PwP in the yellow box above Figure 2a (from 1 to 20 % points) and the graphical displays of Figures 2a and 2b will update. The green box will show the equivalent change in your USR Difference, DiR. Alternatively, you can change the DiR and see the effect on your PwP and other factors in Table 1 and the various graphs. Finally, you will be able to choose to view the results as a function of PwP, or as a function of DiR, or of both together.
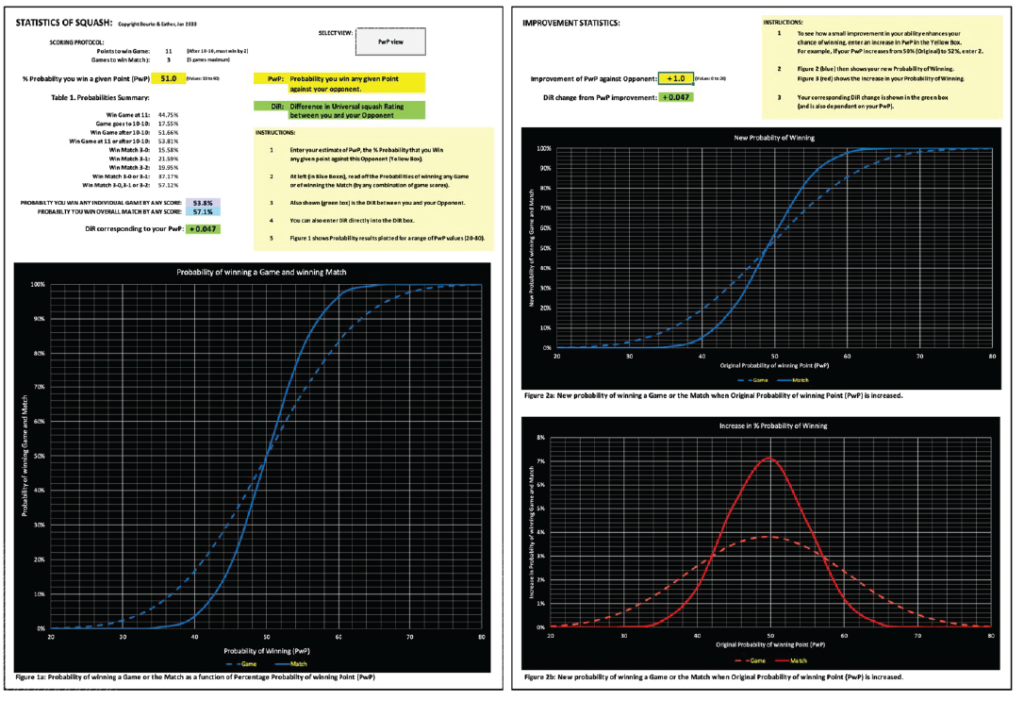
Figure 3: Layout of Squash spreadsheet downloaded from URL provided.
So what is the take from all this? The bad news is that the result of your match is almost a foregone conclusion unless you are playing someone very close to your own ability. A PwP of 40% (which translates to a USSRA rating difference of 0.53), results in just a 3.6% probability of winning the match.
The good news is that if you are playing an opponent of very similar ability, a small increase of 1% in your PwP (by better conditioning, improved shot making, smarter strategy, better attitude, or talking to your therapist) will increase your probability of winning by 7%. The 7% solution!
Central to our analysis is that each point is considered an independent event. Ignore the current score, forget the referee’s terrible call, and think of each new point as the beginning of a three-point mini match, a new game, or a new match. Many top players and coaches have confided that they try to use this mindset strategy.
And a final observation – if you think the scoring protocol in squash is somewhat unfair to the lesser player, tennis is even worse. For example, whereas a PwP of 40% in squash predicts a 3.6% probability of winning the Match, in tennis the prediction is just a 0.05%. The “Tennis” spreadsheet of the Excel Workbook download compares squash to tennis in detail.
References:
- Varun Fuloria, Rutwik Kharkar, and Ryan Rayfield, The Ratings Game – An Analysis of US Squash Ratings. Squash Magazine, Nov. 2021.
- Barry, N, Probability and Tennis, http://datagenetics.com/blog/august12018/index.html